Binary analysis
A reverse engineering analysis of a binary that uses multiple ways of anti-analysis techniques
Initial analysis
When examining a binary file, I first check for readable text strings, but found nothing useful:
1
2
strings output.bin
:[d(u
Static analysis
Loading the file in IDA revealed a pattern common in malicious code:
Anti-Debug
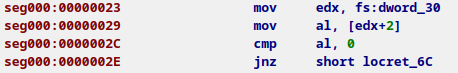
This code works by:
Getting the Process Environment Block address using the FS segment
Reading the BeingDebugged flag at offset + 0x2
Checking if the flag is non-zero
If a debugger is detected, jumping to an exit point
Anti-VM
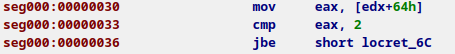
This code:
Reads the NumberOfProcessors value from PEB + 0x64
Checks if the system has 2 or fewer processors
If so, assumes it’s running in a VM and jumps to the same exit point
Payload decryption
Following the anti-analysis technique used, the binary employs a multi-stage decryption routine :
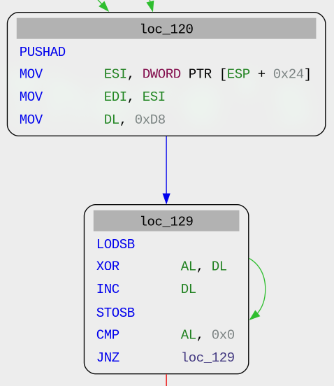
Decryption routine
Registers are saved on the stack
Values are manipulated in ESI, EDI, and DL registers
Implements a XOR-based decryption loop:
Loads bytes from ESI into AL
Performs XOR operation between AL and DL
Increments AL and stores result to EDI
Continues until AL equals 0x0
Functions as a shellcode loader that decrypts values until reaching end of list (0x0)
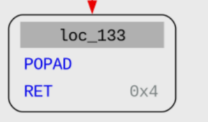
Execution transition
Upon completion of decryption, executes POPAD to restore registers
Returns to loc_57 via RET 0x4
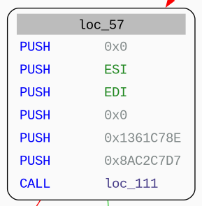
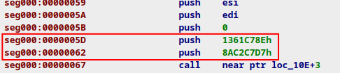
Stack preparation
Pushes multiple values onto the stack (0x0, ESI, EDI, etc.)
Pushes specific hex values (0x1361C78E, 0x8C2C7D7)
Calls loc_111
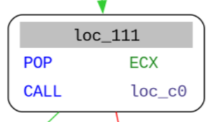
Function pointer setup
Pops a value from stack into ECX register
Calls loc_c0
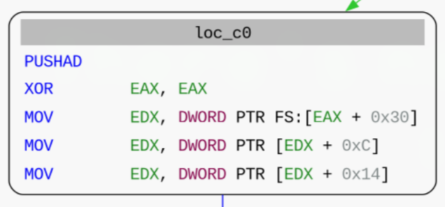
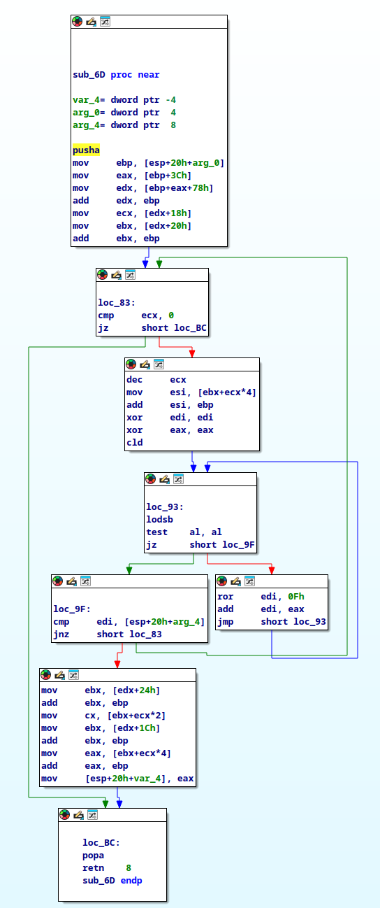
DLL resolution
Sets EAX to 0
Accesses the Process Environment Block (PEB)
Navigates to PEB_LDR_DATA
Locates InMemoryOrderModuleList that contains Flink and Blink structures that are used to traverse loaded modules without calling suspicious APIs
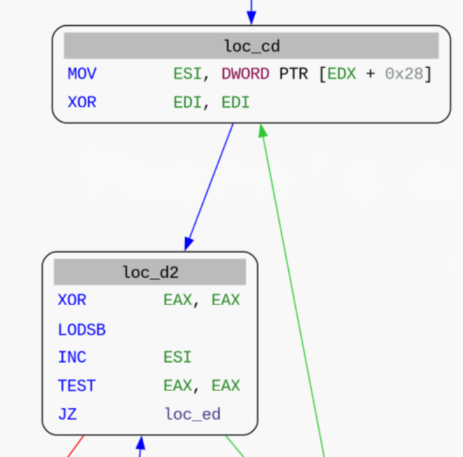
DLL processing
Sets DLL pointer in ESI
Resets EDI to 0
Loads DLL characters byte-by-byte
Tests for end of string (EAX = 0)
Systematically processes DLL characters
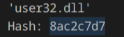
Identifying the loaded DLL
To identify the loaded DLL, we can use a list of common DLLs, use the same hashing method as the binary and just compare the hashes we obtained. All of this will be done with the following script that uses the MIASM framework.
1
2
3
4
5
6
7
8
9
10
11
12
13
14
15
16
17
18
19
20
21
22
23
24
25
26
27
28
29
30
31
32
33
34
35
36
37
38
39
40
41
42
43
44
45
46
47
48
49
from miasm.analysis.machine import Machine
from miasm.core.locationdb import LocationDB
from miasm.jitter.csts import PAGE_READ, PAGE_WRITE, PAGE_EXEC
import sys

# Initialize x86 32-bit emulator
machine = Machine("x86_32")
loc_db = LocationDB()
jitter = machine.jitter(loc_db)

# Mapping shellcode
addr_shellcode = 0x10000
jitter.vm.add_memory_page(addr_shellcode, PAGE_READ | PAGE_WRITE | PAGE_EXEC, b"\x00" * 0x1000, "shellcode décodé")

shellcode = open('output_020.bin', 'rb').read()
jitter.vm.set_mem(addr_shellcode, shellcode)

# Mapping stack memory
addr_stack = 0x20000
jitter.vm.add_memory_page(addr_stack, PAGE_READ | PAGE_WRITE, b"\x00" * 0x1000, "stack")
jitter.vm.set_mem(addr_stack + 0x1000 - 4, b"\xef\xbe\x37\x13")
jitter.cpu.ESP = addr_stack + 0x1000 - 4

# Configure logging
jitter.set_trace_log(trace_instr=False, trace_regs=False, trace_new_blocks=True)

# Mapping dll name
addr_dllname = 0x30000
jitter.vm.add_memory_page(addr_dllname, PAGE_READ, b"\x00" * 0x1000, "dll name")

# Callback function for breakpoint
def dump(jitter):
    print("Hash: %x" % jitter.cpu.EDI)
    return False

# Set breakpoint at shellcode + 0xEB (end of hash computation)
jitter.add_breakpoint(addr_shellcode + 0xEB, dump)

# Process each DLL name from the list file
fdesc = open('dll.list')
for line in fdesc:
    line = line.strip()
    print(repr(line))
    jitter.cpu.ESI = addr_dllname
    jitter.cpu.EDI = 0
    dllname = line + "\x00"
    jitter.vm.set_mem(addr_dllname, dllname.encode("utf-16le"))

    jitter.run(addr_shellcode + 0xD2)
After running this script, we can compare the script output and the hash we previously got using IDA
We can also observe a function that does a decryption routine for the DLLs function
Dynamic analysis
Now that we understand how this binary works, we can dynamically analyse it using a miasm sandbox.
To do so, we will need to do the following :
Create a sandbox on an appropriate version
Inject the binary in the sandbox
Bypass the anti-debug verification
Bypass the anti-vm verification
The script below does it all for us :
1
2
3
4
5
6
7
8
9
10
11
12
13
14
15
16
17
18
19
20
21
22
23
24
25
26
27
28
29
30
31
32
33
34
from pdb import pm
from miasm.analysis.sandbox import Sandbox_Win_x86_32
from miasm.core.locationdb import LocationDB
from miasm.jitter.csts import PAGE_READ, PAGE_WRITE, PAGE_EXEC

# Initialize parser
parser = Sandbox_Win_x86_32.parser(description="PE sandbox")
parser.add_argument("filename", help="PE FILENAME")
options = parser.parse_args()

# Initialize sandbox
loc_db = LocationDB()
sb = Sandbox_Win_x86_32(loc_db, options.filename, options, globals())

# Mapping shellcode
addr_shellcode = 0x4000000
sb.jitter.vm.add_memory_page(addr_shellcode, PAGE_READ | PAGE_WRITE | PAGE_EXEC, b"\x00" * 0x1000, "shellcode")

# Mapping PEB isDebugged flag
addr_peb_flag = 0x7FFDF002
sb.jitter.vm.add_memory_page(addr_peb_flag, PAGE_READ | PAGE_WRITE, b"\x00" * 0x1, "PEB isDebugged")
sb.jitter.vm.set_mem(addr_peb_flag, b"\x00")  # Bypass the check by setting the isDebugged flag to 0

# Mapping PEB NumberOfProcessors flag
addr_peb_check = 0x7FFDF064
sb.jitter.vm.add_memory_page(addr_peb_check, PAGE_READ | PAGE_WRITE, b"\x00" * 0x4, "PEB NumberOfProcessors")
sb.jitter.vm.set_mem(addr_peb_check, b"\x03")  # Bypass the check by setting the NumberOfProcessors to 3

# Set shellcode
shellcode = open('output_012.bin', 'rb').read()
sb.jitter.vm.set_mem(addr_shellcode, shellcode)
sb.jitter.cpu.EAX = addr_shellcode

sb.run(addr_shellcode)
We can then run the script with the command below so we are able to interact with the sandbox
1
python3 -i sandbox.py miasm/example/samples/box_upx.exe -b -s -y -l
The arguments used are the following :
-b : Log disasm blocks
-s : Use segments
-y : Create and use windows structures
-l : Load base dll
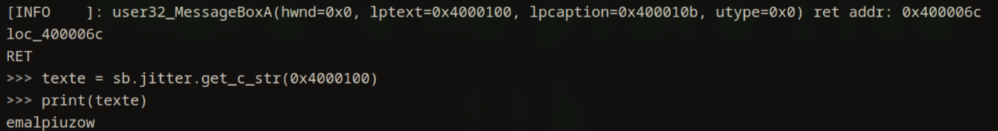
Once the script finished running, we can observe that a user32_MessageBoxA is present with the text present at 0x4000100
When we print the value at 0x4000100, we can obtain the flag !
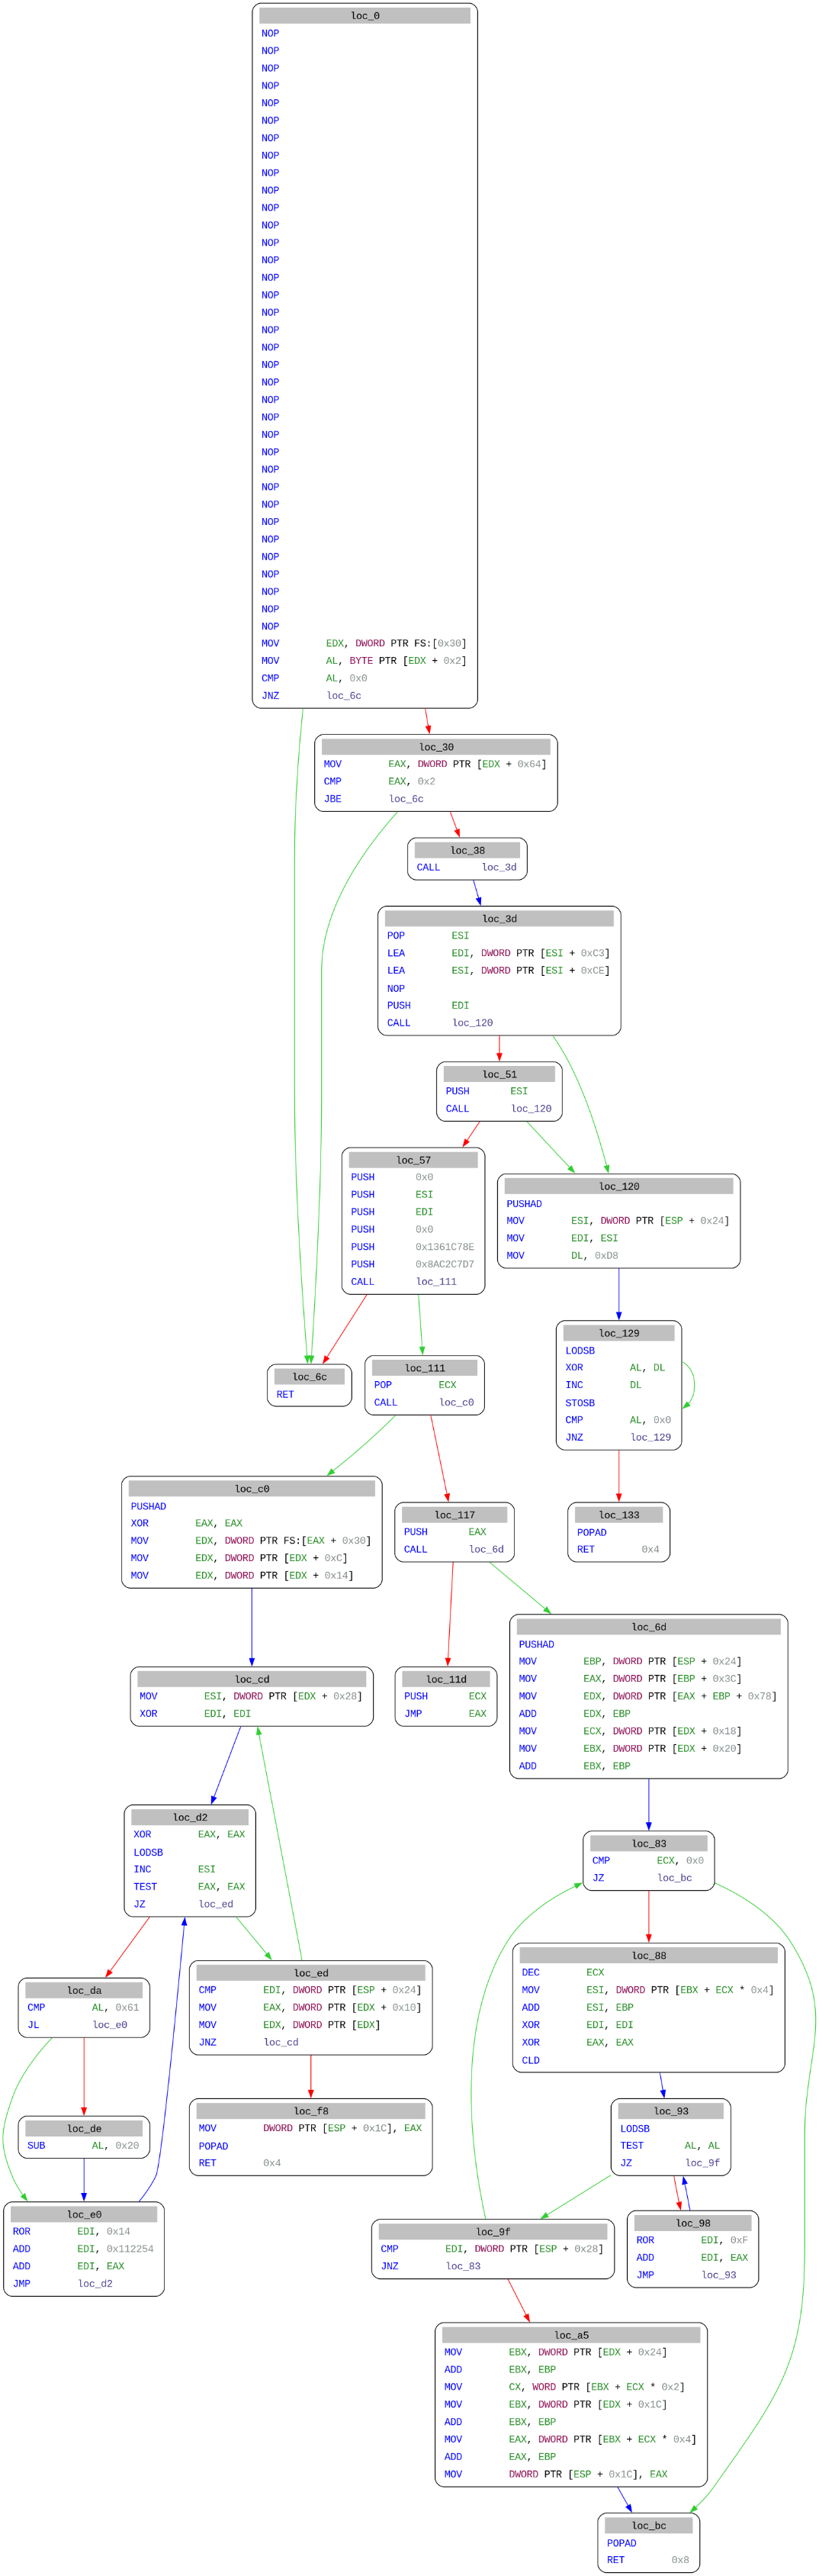
Execution flow
Conclusion
This analysis revealed a binary employing multiple anti-analysis techniques:
Anti-debugging checks via the PEB’s BeingDebugged flag
Anti-VM detection by counting processors
Using both static analysis and dynamic analysis, I was able to:
Bypass the protective measures
Understand the execution flow
Decrypt the payload
Identify the final action, a MessageBoxA call displaying a flag
Special thanks to serpilliere for the binary, esgr0bar, offpath and mins for the help given on the analysis
Sources : MIASM - PEB STRUCTURE